Drawings aren’t just for conveying meaning; the act of drawing itself helps you understand. And few drawings are more helpful for understanding complex ideas than concept maps. However, concept mapping can be surprisingly challenging. In this post, I’ll explain the basics and give you pointers to get started.
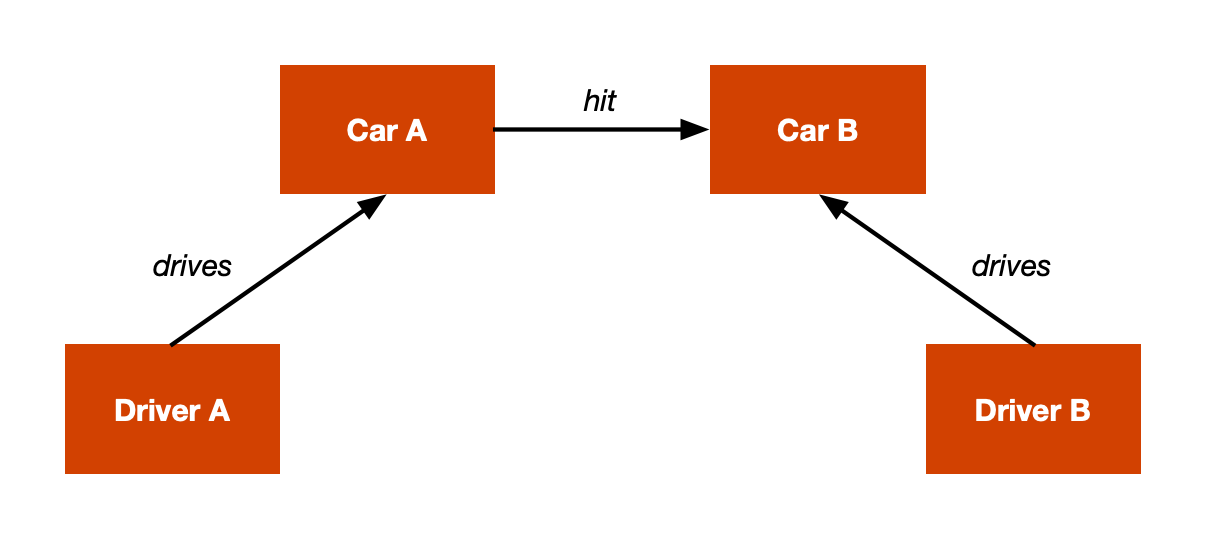
A concept map is a diagram that represents relationships between concepts or entities. As such, it represents a model of a system or situation. This definition is broad enough to cover lots of scenarios. For example, as I wrote this, two cars crashed in front of my house. Fortunately, it was minor, and nobody was hurt. Here’s a concept map of what happened:

The two cars are key concepts; without them, it’d be impossible to describe this incident. The arrow that connects them defines the relationship. Its label (“hit”) matters: without it, we’d understand that Car A did something to Car B, but we wouldn’t know what.
As I watched the accident unfold, I wondered what would happen next. We can expand the diagram to explore the possibilities. Let’s start with the fact these aren’t autonomous vehicles; each is driven by a person:
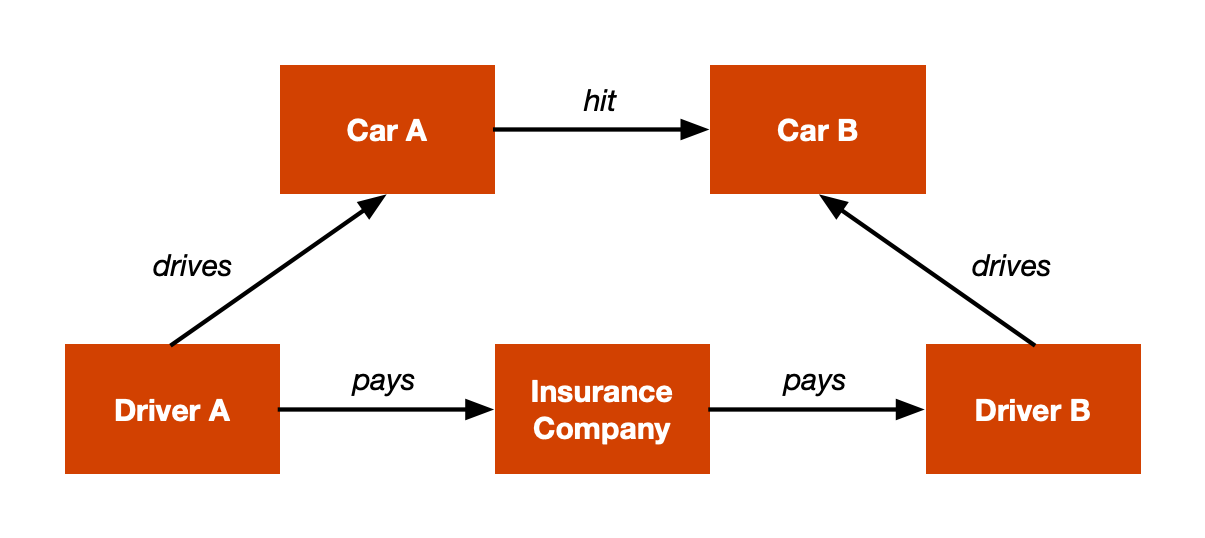
As expected, they pulled over to examine the damage. The cars seemed drivable, but at least one had a crumpled fender. Both will likely go to a shop, and someone must pay. We can expand our diagram:
We could keep going, but let’s stop here and observe a few things:
-
The diagram consists of boxes (in technical jargon: nodes or vertices) that define concepts, and links (technically: edges) that define relationships between concepts.
-
Both nodes and the links between them are labeled. That is, there are words in nodes and over links that clarify what they represent.
-
Links are directional: they’re rendered as arrows to suggest one node affects another.
-
Node labels are nouns and link labels are verbs. As such, the diagram establishes semantic relationships between entities.
-
Some of these relationships are hierarchical. For example, each driver controls a particular vehicle; this is a fixed structural feature of this situation.
It sounds simple, but drawing concept maps can be challenging. To start, the idea of “concepts” is somewhat abstract. What is a “concept” will vary from one scenario to another. One way to think about it is that concepts are the key ideas, people, things, etc., that participate in the scenario. Again, think of them as nouns in a sentence.
Another challenge is knowing when to stop. In the diagram above, I drew a node for Driver A’s insurance provider but not one for Driver B’s. I also left out the body shop. Why? Because otherwise, the diagram would get too complex for my purpose. (I.e., illustrating concept maps.)
A richer diagram might be more “true” but less useful. My purpose here isn’t to understand how these drivers will settle their situation but to show you a simple example. You must be clear on your purpose when making these diagrams. (That said, sometimes mapping will help you uncover latent purposes. In that case, start a new, focused map.)
Another common pitfall is writing too much in individual boxes and arrows. Remember: nodes represent discrete concepts. Beware of verbs creeping into nodes! If they do, you may be trying to stuff more than one concept into a node. (The same goes for links: I’ve seen students write whole sentences connecting nodes, a sure sign of muddled thinking!)
Yet another challenge is lapsing to making other, more familiar diagrams. In particular, concept maps aren’t necessarily hierarchical, like sitemaps or mind maps. (Mind maps are especially tricky since so many people use them for brainstorming.) These diagrams have uses but can’t represent relationships as richly as concept maps.
Concept maps are handy when understanding complex, dynamic ideas, systems, and situations. They give you ways to communicate models. Your first map will likely be wrong, but it will concretize your models so other people can correct them. You then make another map, and then another, and gradually get closer to the truth.
Whether you’re a designer working in a complex domain or a student learning a complicated subject, drawing concept maps will give you an edge. Here are a few guidelines to get you started:
- Start by defining the key concepts; it’s easier to consider the nouns before the verbs.
- Keep it simple: leave out the inessential.
- Keep labels short: labels with more than three words are suspect.
- Links should be directional — i.e., they should always be arrows; if two nodes influence each other, draw and label two separate arrows.
- Clarify semantic relationships: each concept should be distinct from others. Sets of two concepts and an arrow should read like valid sentences. (E.g., “Car A hit Car B.”)
- Your map should be understandable without needing you to explain it; show it to others without saying anything to see if they get it.
- Iterate! The first version will likely be a muddle; make another, and then another; refine and simplify with each step.
Finally, Hugh Dubberly – a contemporary master of model diagrams — published a short step-by-step process for making concept maps. It’s the one I share with my students every spring — I hope you find it useful!
A version of this post first appeared in my newsletter. Subscribe to receive posts like this in your inbox every other Sunday.